April 23, 2026

Data Quality: Why It Determines Over 25% of Your Revenue — and How to Measureably Improve It

Gernot Lepuschitz

By Gernot Lepuschitz

Chief Technology Officer

Datenqualität: Warum sie über 25 % Ihres Umsatzes entscheidet

22 min read

Share this post

Anyone who reads this article will understand what data quality really means, what dimensions it encompasses, and why poor data has been shown to cost companies millions. You’ll learn about the four root causes of poor data quality, receive a proven framework for improvement, a comparison table of quality dimensions, a real-world example, and an FAQ for data managers.

Key Points

  • Definition: Data quality describes how well data fulfills its purpose—as measured by dimensions such as completeness, accuracy, consistency, uniqueness, timeliness, and validity.

  • The costs are well documented: Gartner estimates that poor data quality causes an average annual loss of at least $12.9 million per company.

  • Up to 25% of revenue: Data quality expert Thomas Redman shows that flawed data can wipe out 15 to 25% of revenue.

  • Six dimensions are key: The DAMA-UK framework defines completeness, uniqueness, consistency, correctness, validity, and timeliness as standard metrics.

  • Data quality is not a cleanup project: It is an ongoing governance process with clear responsibilities and measurable KPIs.

  • AI raises the bar: Without robust data quality, automation merely scales existing errors.

  • Goldright provides the foundation: With over 20 years of experience in master data management, Goldright makes data quality measurable and controllable.

What Is Data Quality? The Definition

Data quality describes how well a dataset fulfills its purpose—that is, how complete, accurate, consistent, unique, current, and valid the stored information is. It is not a binary property, but rather a multidimensional measure whose composition varies depending on the use case.

The DAMA UK framework has established itself as the standard, defining six core dimensions: completeness, unambiguity, consistency, correctness, validity, and timeliness. Since 2013, these dimensions have formed the basis for numerous data quality tools and have been adopted, among others, in the UK Government Data Quality Framework.

High data quality does not mean that every single data field must be perfect. It means that the data is sufficiently reliable for the specific business purpose—a billing address must be correct, whereas an optional free-text field for internal notes need not be. Data quality must therefore always be evaluated in the context of its intended use.

Data quality is particularly closely linked to master data: customer, supplier, product, and employee data are the entities most severely impacted by quality deficiencies because they are used simultaneously by numerous processes. Our guide to master data provides an in-depth introduction.

It is important to distinguish this concept from related terms. Data quality is not the same as data quantity—more data does not automatically lead to better decisions if its reliability is questionable. Nor is data quality synonymous with data security: A dataset can be extremely well protected and still contain incorrect information. Data quality refers exclusively to the accuracy of the content and the usability of the data itself.

The term “master data quality” is often used synonymously with “data quality,” but it is more precisely defined: It refers specifically to the quality of master data as a subset of all corporate data. Since master data are the most stable and widely used data objects, master data quality is often the most important lever in practice for tangibly improving the data quality of an entire company.

Why Is Data Quality So Important?

Data quality has evolved from a quiet IT metric to a strategic success factor. Four proven facts show why this topic belongs on every CDO’s agenda. The common thread: Whereas a data error used to result in an incorrect invoice, today the same error can derail an AI project or jeopardize regulatory approval.

1. Poor data quality has been proven to cost millions

Gartner estimates the average annual cost of poor data quality at at least $12.9 million per company—a figure cited as an industry benchmark that encompasses productivity losses, poor decision-making, and compliance costs.

2. Faulty data destroys revenue

Data quality expert Thomas Redman demonstrates in his widely cited analysis that poor data quality can cost companies 15 to 25% of their revenue—due to rework, poor decisions, and a loss of trust in their own figures. For a company with 500 million euros in revenue, that amounts to a potential loss of 75 to 125 million euros annually.

3. AI Projects Fail Because of the Data Set, Not the Algorithm

Gartner expects that by 2026, approximately 60% of AI projects that are not supported by AI-ready data will be abandoned. Data quality is therefore not only an operational risk but also a strategic risk for every automation and AI initiative.

4. Regulation Increases the Pressure for Clean Data

Article 10 of the EU AI Act (Regulation (EU) 2024/1689) explicitly requires relevant, representative, and largely error-free training, validation, and test datasets for high-risk AI systems. Data quality is therefore no longer optional for many companies, but rather a compliance requirement.

Where the Costs of Poor Data Quality Actually Arise

The costs of poor data quality are rarely visible in a single line item—they are spread across numerous processes and only add up to the magnitudes documented by Gartner and Redman when viewed in their entirety. Four cost drivers recur in nearly every company.

Operational Inefficiencies

Duplicate data maintenance across multiple systems, manual corrections, and rework tie up resources that are then lacking elsewhere. Every invoice that must be manually corrected due to an incorrect supplier address costs time, which adds up to a significant amount over thousands of transactions per year.

Poor Decisions at the Executive Level

Reports and analyses are only as reliable as the underlying data. When executives make decisions based on contradictory metrics, the resulting poor decisions are often the most costly consequences of poor data quality—even if they are harder to quantify than a single incorrect invoice.

Regulatory Risks

GDPR violations due to incomplete or incorrect personal data, back taxes resulting from erroneous filings, and audit findings stemming from inconsistent business data are direct, often underestimated follow-up costs. For companies in the DACH region, these requirements are becoming increasingly stringent.

Loss of Trust and Slowed Decision-Making

DThe effect that is hardest to measure but most costly in the long run: When employees and managers no longer trust their own data, every decision is slowed down by additional manual checks. This doesn’t just affect a single invoice—it slows down the entire company.

A Comparison of the Six Dimensions of Data Quality

To improve data quality, you must first break it down into its components. The following six-dimensional model, based on DAMA UK, has established itself as the standard in practice—it allows you to pinpoint quality issues precisely, rather than speaking in general terms about “bad data.”

Dimension

Key Question

Example of a Violation

Typical KPI

Completeness

Have all required fields been filled in?

Missing phone number in the customer record

Percentage of complete records

Accuracy

Do the values reflect reality?

Incorrect company name in the commercial register

Error rate per sample

Consistency

Do the systems match?

Two addresses for the same customer

Discrepancy rate between systems

Uniqueness

Is there only one record per object?

The same supplier was created twice

Duplicate rate

Validity

Does the data comply with the format/rules?

Invalid tax ID, incorrect date format

Percentage of records compliant with rules

Timeliness

Is the data up to date?

Outdated executive data

Average age of records

Not every dimension is equally critical for every use case. For supplier payment data, accuracy is paramount because errors lead to incorrect payments. For customer master data, uniqueness is crucial, while for regulatory data, timeliness and validity are key. A good target framework specifies, for each use case, which dimension must meet which threshold—experience shows that blanket quality targets without this prioritization are ineffective.

In practice, the most business-critical dimension is usually uniqueness. Duplicates are the most costly and common quality defect because they directly result in duplicate payments, distorted revenue analyses, and contradictory customer histories. Industry benchmarks show that companies without formal data quality processes regularly have duplicate rates of 10 to 30%—a figure that can only be sustainably reduced through systematic validation.

Measuring Data Quality: KPIs and Methodology

Data quality can only be managed if it is measured. Without a baseline, it is impossible to demonstrate progress or justify a business case to the board. In practice, two categories of metrics have proven effective: quantitative metrics and qualitative indicators.

Quantitative Metrics

Quantitative metrics can be collected automatically and on a regular basis: the completeness rate of critical required fields, the number of identified and resolved duplicates, the average time to update changed data records, and the percentage of automatically validated data records. These metrics form the backbone of every data quality dashboard.

Qualitative Indicators

Qualitative indicators provide additional context: employee satisfaction with the data, the reduction in manual corrections in day-to-day operations, the perceived improvement in decision-making speed, and the assessment by external auditors during audits. While they are more difficult to automate, they are often crucial for the acceptance of a data quality initiative within the company.

The Right Frequency for Measurement and Reporting

Critical domains, such as customer or supplier master data, should be monitored continuously, with automated alerts triggered when thresholds are exceeded. Less critical domains can be checked on a quarterly basis. It is important that the measurement frequency matches the rate of change of the respective data—rigid, uniform review cycles for all domains waste resources in non-critical areas and overlook problems in critical ones.

The Four Root Causes of Poor Data Quality

Before a company invests in tools, it should understand the actual causes of its data quality problem. In practice, four recurring root causes emerge—they are rarely technical in nature, but mostly organizational.

Root Cause 1: Evolving System Landscapes Without Centralized Governance

Most companies have grown over decades—both organically and through acquisitions. The result is a patchwork of ERP instances, legacy systems, and cloud applications, each of which maintains its own version of the truth about customers, products, and suppliers. Without a central authority for data quality, inconsistency becomes systemic and inevitable.

Every new cloud application that a business unit introduces on its own creates yet another data silo. Without an overarching authority to define which system is the primary source for which domain, the number of conflicting versions grows faster than an organization can manually reconcile them.

Root Cause 2: Lack of Data Ownership

“Whose data is this?” — in many organizations, this question remains unanswered. If no one is responsible for a dataset, no one actively maintains it. IT manages systems but not content; business units maintain content in spreadsheets but not in the system. Without designated data owners, every quality initiative is doomed to fail.

Data ownership is therefore not a bureaucratic detail, but the lever with the greatest impact. As soon as a designated person from the business unit is responsible for the quality of a domain—with a clear mandate and the right tools—behavior changes noticeably. Anonymous data sets become well-maintained assets with a face behind them.

Root Cause 3: No Validation at the Source

Most data quality issues arise during initial data entry—due to missing required fields, missing format checks, or missing duplicate checks. If an erroneous data record is cleaned up only after the fact, it has already been incorporated into dozens of downstream processes and reports. Prevention is always less costly than correction.

This becomes particularly critical during manual initial data entry without any system support—for example, when a new supplier is added via an email attachment. Without automated validation at the time of entry, every typo, every incomplete entry, and every unnoticed duplicate makes its way directly into the production database.

Root Cause 4: Data Quality as a One-Time Project Rather Than an Ongoing Process

Many companies clean up their data once—as part of a migration or an audit—and then consider the issue resolved. Without continuous monitoring and established processes, however, data quality reverts to its original level within a few months because new employees, new systems, and new processes constantly introduce fresh inconsistencies.

Not a Data Cleansing Problem, but a Governance Problem

The most common misconception about data quality is treating it as a technical cleanup project—a one-time cleanup carried out by IT or an external service provider before returning to “actual” business operations. This perspective explains why so many data quality initiatives revert to their original state after a short time.

The sustainable perspective is different: Data quality is the result of governance—of clear responsibilities, binding rules, and continuous measurement. Technology can support and automate this process, but it does not replace it.

Incorrect Framing

Correct Framing

“We’ll clean up the data once.”

“We’ll establish long-term data quality governance.”

“Data quality is an IT issue.”

“Data owners in the business units are responsible.”

“A tool solves our problem.”

“Governance and processes come before technology.”

“We need better data.”

“We define measurable targets for each dimension.”

“Quality is complete when the project ends.”

“Quality is continuously measured and managed.”

This shift in perspective has practical implications for the budget, sponsorship, and roadmap. If data quality is treated as a governance issue, it receives C-level sponsorship and a permanent structure rather than a temporary project budget. Learn more about the role of governance in master data management in the article on the Golden Record.

Approach: Five Steps to Measurable Data Quality

Data quality cannot be achieved overnight, but it can be systematically improved. The following framework describes the proven approach that Goldright uses in enterprise projects.

Step 1 — Measure the Status Quo

Before improvements can be made, the current status must be measured for each dimension: What are the duplicate rate, completeness rate, and error rate? This baseline is a prerequisite for any subsequent proof of success. It should cover the entire critical data set, not just samples—only then can it be credibly demonstrated later that a measure has actually been effective.

Step 2 — Prioritize Critical Data Domains

Not all data is equally important. Which domain—customers, suppliers, products, financial data—has the greatest business impact when quality issues arise? That’s where improvement begins, not everywhere at once. This prioritization prevents resources from being wasted on non-critical areas while the actual pain points remain unaddressed.

Step 3 — Define data ownership and rules

For each prioritized domain, a data owner is designated, and binding validation rules, required fields, and approval workflows are established. Without this governance structure, any technical measure will be ineffective.

Step 4 — Automate validation at the source

Data validation, required fields, and duplicate checks are built directly into the data entry process. Goldright’s Agile Data Manager enables low-code configuration of validation rules—without the need for complex development projects.

Step 5 — Monitoring, KPIs, and Continuous Improvement

Quality KPIs are continuously monitored, and deviations are automatically reported. Regular reporting makes progress visible and provides the basis for demonstrating ROI to the executive board. This final step is the one that many organizations underestimate—without it, even the best data set will deteriorate within a few months because new systems and processes constantly introduce fresh inconsistencies.

How good really is your data quality?

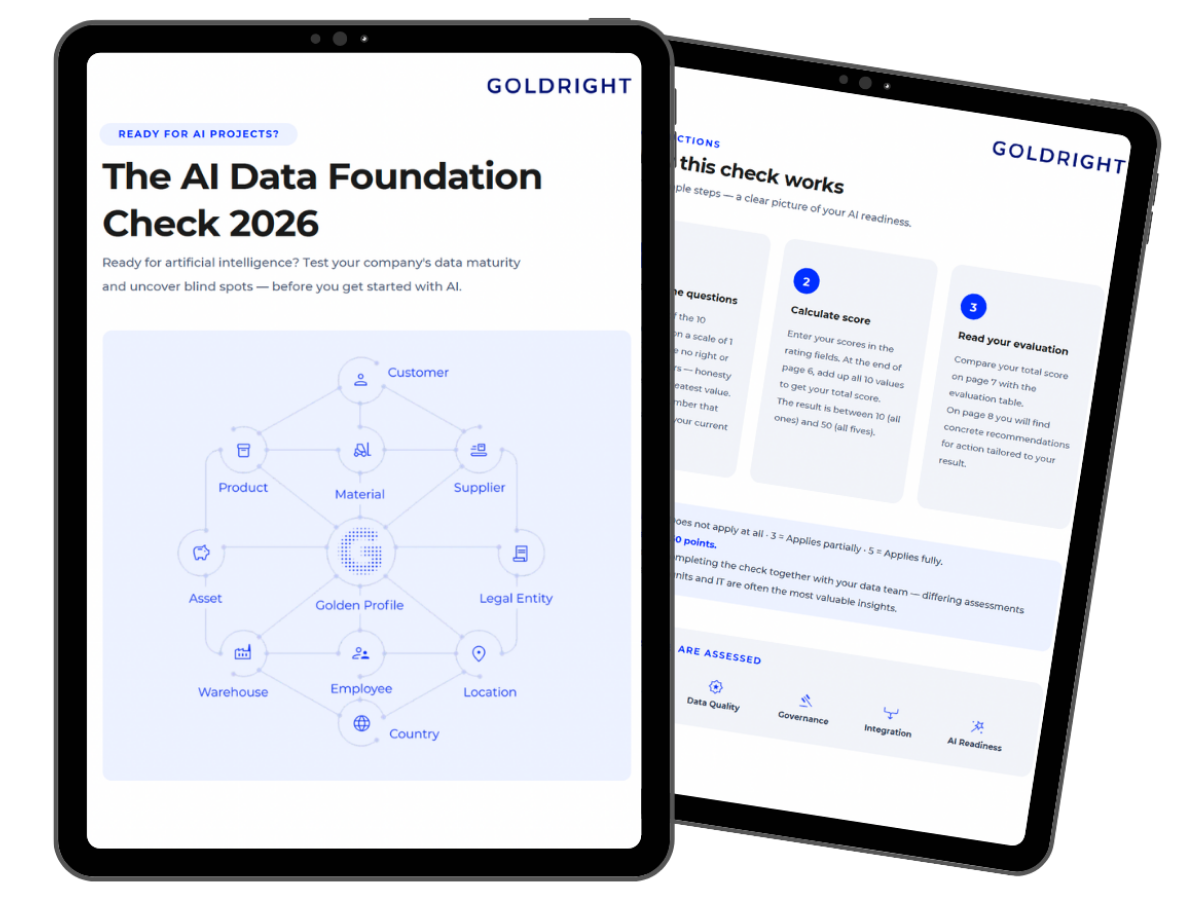
Most companies overestimate their data quality—until an audit or a failed AI project proves otherwise. The AI Data Foundation Check provides you with an objective assessment in just 15 minutes.

  • Evaluation score for all data dimensions

  • Ready-to-use roadmap template

  • 100% free

A Comparison of Data Quality Assurance Approaches

Companies use a variety of approaches to ensure data quality—ranging from manual verification to automated master data management. The following table categorizes the most common approaches based on effort, sustainability, and scalability.

Approach

Effort

Sustainability

Scalability

Typical Result

Manual spot checks

Low

Minimal

Poor

Isolated errors found, no trend

One-time data cleanup

High (one-time)

Very low

Poor

Short-term improvement, rapid decline

Rule-Based Validation at the Source

Medium

High

Good

Fewer new errors; existing errors remain

Automated Monitoring + Dashboards

Medium

High

Very good

Continuous visibility, rapid response

Dedicated Master Data Management

High (initial)

Very high

Very good

Golden Record, permanently ensured quality

The table reveals a pattern: Approaches that require little initial effort rarely yield sustainable results. Only the combination of rule-based validation, continuous monitoring, and a central governance body—as provided by dedicated master data management—ensures data quality in a sustainable and scalable manner across growing data volumes and system landscapes.

For most companies, the pragmatic approach is a combination: rule-based validation at the source for new data records, automated monitoring of existing data, and a phased migration of critical domains into a central master data management system. The “big bang” approach—transferring all data into a new system at once—regularly fails in practice due to complexity and resistance, whereas phased migration delivers measurable results that justify further investment.

The Technology Dimension: AI, Automation, and Data Quality

Modern technologies are transforming how data quality is ensured. Artificial intelligence and machine learning identify patterns in large volumes of data that human reviewers would miss—such as subtle variations in the spelling of the same company name or statistical outliers in data series.

Today, automated data cleansing encompasses the detection and consolidation of duplicates, real-time validation of addresses against external reference databases, and, increasingly, predictive analytics that anticipate quality issues before they impact downstream processes.

Technology does not replace governance; it reinforces it. An AI-powered validation system without defined rules and responsibilities may make decisions faster, but not necessarily better ones. Sustainable benefits only arise when automation is built on a solid foundation of governance—rules defined and owned by a data owner and consistently enforced through technical means.

Best Practices: Improving and Measuring Data Quality

From numerous data quality projects, six principles can be derived that distinguish sustainable improvement from short-lived cleanup efforts. They may sound unspectacular—but that is precisely their value, because the most common errors arise not from a lack of technology, but from skipping these fundamentals.

1. Present the business case in euros, not in percentage points

“The completeness rate increases by 10%” rarely convinces the executive board. “We avoid 400,000 euros in erroneous payments per year” does. A robust business case quantifies the costs of current quality deficiencies in euros—through manual correction efforts, erroneous payments, and delayed processes. This figure is the strongest argument before the executive board, more powerful than any single quality metric.

2. Start with one domain, then scale

Successful projects start where the benefits become visible the fastest—usually with customer or supplier master data. Success in one domain provides the benchmark for the next.

3. Validation Before Data Cleansing

Preventing errors is always less expensive than correcting them after the fact. Automated rules at the data source are more effective than any subsequent data cleansing effort.

4. Embed data ownership in the business units

Data quality fails when it is viewed as an IT task. Business units understand the business significance of a field—they must take responsibility, while IT provides the platform. Only by working together can a set of rules be created that works in day-to-day operations rather than missing the mark.

5. Set Measurable Targets for Each Dimension

“Better data” is not a goal. “Reducing the duplicate rate from 28% to under 2% in six months” is one. Only measurable goals allow for progress tracking and robust proof of ROI.

6. Monitor Quality Continuously, Not Just Once

A dashboard with quality KPIs that is continuously updated prevents a return to the initial state. Monitoring is not an add-on, but the core of sustainable data quality—the difference between a project with an end date and a permanently functioning operational mode.

Case Study: Improving Data Quality in the Supplier Database

The following case study has been anonymized for data protection reasons and is based on a real-world project.

Initial Situation

An international industrial group with over 80 subsidiaries in 14 countries managed supplier data across four different SAP systems. Internal analyses revealed a duplicate rate of 28% across more than 34,000 data records, as well as numerous outdated bank account details and inconsistent categorizations.

Challenge

The root cause was not the software, but a lack of governance: There was no defined data owner, no standardized validation rules, and no version history. Each regional team considered its own version of the data to be correct—a political challenge at least as significant as a technical one.

Approach

Following an assessment, the Agile Data Manager was implemented as a central authority. Validation rules, required fields, and workflow logic were configured using low-code tools, while the regional teams remained involved as data owners.

Results after six months

  • Duplicate rate: reduced from 28% to less than 1.5%

  • Manual data correction: reduced by 67%

  • Supply chain error rate: decreased by 43%

  • Audit readiness: the first external audit was completed entirely digitally

In euro terms, the project paid for itself in the very first year: The reduction in manual effort and the avoidance of erroneous payments to duplicate suppliers significantly exceeded the project costs. Equally important was the qualitative impact: For the first time, the Executive Board trusted the procurement figures again without manual cross-checking.

Lessons from the case: The decisive success factor was not the technology, but clear data ownership and binding validation rules—measurable in a payback period as early as the first year.

Pitfalls: What Often Goes Wrong in Data Quality Projects

Most failed data quality projects fail for the same reasons—rarely because of the technology. These reasons are the exact opposite of best practices and, in practice, are surprisingly persistent.

  • Lack of executive-level sponsorship: Without a clear commitment, projects fail due to budget cuts and resistance.

  • Technology Before Governance: A tool without a data model and clear rules only produces more expensively organized data garbage.

  • Big-Bang Cleanup: Large one-time projects lose sponsorship before results become visible. Better: Start with one domain, demonstrate quick results, then expand.

  • Cleanup without a process: Without ongoing monitoring, data returns to its original state six months after the cleanup.

  • Business units left out: Data owners must come from the business units—IT only provides the platform.

  • No KPIs: Without measurable goals, there are no success criteria and no reliable proof of ROI.

Do you know your duplicate rate?

Most CDOs know that their data quality has room for improvement—but very few know just how much. The AI Data Foundation Check answers three questions in 15 minutes:

  • Where are your biggest data quality risks?

  • Which dimensions are critical?

  • What’s the best next step?

FAQ: The Most Frequent Questions About Data Quality

What is data quality?

Data quality describes how well data fulfills its purpose—as measured by dimensions such as completeness, accuracy, consistency, uniqueness, validity, and timeliness. High data quality means that data is sufficiently reliable for its intended business purpose.

What are the dimensions of data quality?

The established DAMA-UK framework defines six dimensions: completeness, uniqueness, consistency, accuracy, validity, and timeliness. Depending on the use case, different dimensions may be more or less critical.

How can data quality be measured?

Data quality is measured using KPIs for each dimension: completeness rate of required fields, duplicate rate, error rate per sample, discrepancy rate between systems, and average age of data records. It is important to conduct a baseline measurement before implementing any improvement measures.

How can data quality be improved?

Sustainable improvement follows five steps: Measure the status quo, prioritize critical domains, define data ownership and rules, automate validation at the source, and continuously monitor quality. One-time data cleanses without this structure lose their effectiveness within a few months.

What does poor data quality cost a company?

Gartner estimates the average annual cost of poor data quality at at least $12.9 million per company. Thomas Redman shows that inaccurate data can wipe out 15 to 25% of revenue—through rework, poor decisions, and a loss of trust. These costs are spread across many small items such as duplicate payments, manual rework, and delayed closings.

What is the difference between data quality and master data quality?

Data quality is the umbrella term for the quality of all types of data. Master data quality refers specifically to master data—that is, customer, supplier, product, and employee data that rarely changes and is used by many processes. Because master data is used so widely, quality issues there have a particularly significant impact.

Who is responsible for data quality within the company?

Operational responsibility lies with the data owners in the business units, while strategic oversight typically falls to the Chief Data Officer (CDO). IT provides the technical platform. This three-way division forms the backbone of any effective data quality governance.

How are data quality and AI related?

AI models are only as good as their data foundation. Gartner expects that by 2026, around 60% of AI projects will fail due to poor data quality. Without consistent, accurate data, AI amplifies existing errors rather than improving efficiency. The EU AI Act also requires verifiable data quality for high-risk systems under Article 10.

What is a duplicate rate, and why is it important?

The duplicate rate measures the proportion of duplicate records for the same business object. It falls under the dimension of uniqueness and is usually the most costly quality defect: For example, a duplicate supplier record leads to duplicate payments. Industry benchmarks show duplicate rates of 10 to 30% in the absence of formal data quality processes.

What role does data governance play in data quality?

Data governance defines who is responsible for which data, what rules apply, and how quality is measured. Without governance, any technical measure aimed at improving data quality remains ineffective because no one ensures ongoing compliance with the rules.

Is a one-time data cleanup sufficient?

No. Without a continuous process and monitoring, even a freshly cleaned dataset will deteriorate again within a few months because new employees, systems, and processes constantly introduce new inconsistencies. Data quality is an operational mode, not a project.

How does Goldright support companies with data quality?

With the Agile Data Manager, Goldright offers a low-code platform that embeds validation rules, required fields, and approval workflows directly at the data source—including native version history. This makes data quality measurable and continuously manageable, rather than requiring a one-time cleanup.

How long does it take to improve data quality sustainably?

With a structured approach, noticeable improvements can often be achieved in one initial domain within three to six months. Company-wide, sustainable data quality governance across multiple domains is an ongoing process with no fixed end date—featuring clear milestones rather than a one-time completion.

What is the difference between data quality and data governance?

Data governance is the overarching framework of policies, roles, and responsibilities for handling data. Data quality is one of the key outcomes of good data governance: Without defined responsibilities and processes, data quality cannot be ensured in the long term but can, at best, be improved on an ad hoc basis.

Outlook: Why Data Quality Is Becoming a Leadership Responsibility

The link between data quality and business success is no longer an abstract concept but a proven metric. As automation and the use of AI grow, this link becomes even more pronounced: Every automated decision based on flawed data is made faster and in greater numbers than a manual one—and is therefore potentially more costly.

This is particularly relevant for regulated industries such as financial services, energy, and manufacturing. The EU AI Act makes traceability of data quality an explicit requirement for high-risk AI applications. Those who invest in data quality governance today are not only building operational efficiency but also laying the foundation for regulatory compliance in the future.

For CDOs and Heads of Data Analytics, this shifts their role: from managers of a cost center to architects of a measurable competitive advantage. Those who systematically manage their company’s data quality today help determine which automation and AI initiatives will function reliably tomorrow.

Conclusion: Data quality is governance, not cleanup

The core message of this article can be summarized in one sentence: Data quality determines up to 25% of your revenue—and it is not achieved through a one-time cleanup, but through ongoing governance.

Those who understand the six dimensions, prioritize their most critical data domains, establish clear data ownership, and continuously measure quality transform data quality from a cost factor into a controllable, measurable competitive advantage. Those who rely on one-time cleanups, on the other hand, will pay the price again—at the latest during the next audit or AI project.

The path to this goal is not a “big bang,” but a sequence of controlled steps: measure the status quo, prioritize domains, establish governance, automate validation, and monitor continuously. Each step delivers its own benefits and funds the next.

Goldright guides you along this path with over 20 years of experience in master data management and proven references such as ÖBB, ANDRITZ AG, and GRAWE. The first step is an honest assessment of your current situation: The AI Data Foundation Check provides this in just 15 minutes. Learn more about the technical implementation from the Agile Data Manager.

Sources

Gartner: "Data Quality: Why It Matters" — https://www.gartner.com/en/data-analytics/topics/data-quality

Thomas Redman: "Impact of Poor Data Quality" — https://agiledata.org/essays/impact-of-poor-data-quality.html

DAMA UK / UK Government: "Data Quality Framework — six core dimensions" — https://www.gov.uk/government/publications/the-government-data-quality-framework/the-government-data-quality-framework

Gartner: "Lack of AI-Ready Data Puts AI Projects at Risk" — https://www.gartner.com/en/newsroom/press-releases/2025-02-26-lack-of-ai-ready-data-puts-ai-projects-at-risk

Europäische Commission: EU AI Act, Regulation (EU) 2024/1689, Art. 10 — https://eur-lex.europa.eu/legal-content/DE/TXT/?uri=CELEX:32024R1689

Gartner: Master Data Management (MDM), Glossary-Definition — https://www.gartner.com/en/information-technology/glossary/master-data-management-mdm